> For the complete documentation index, see [llms.txt](https://docs.ins-pi.com/llms.txt). Markdown versions of documentation pages are available by appending `.md` to page URLs; this page is available as [Markdown](https://docs.ins-pi.com/blueprints/review-and-share/reviews.md).

# Reviews

{% hint style="success" %}
**New in 26.1.** Reviews does not appear on earlier versions.
{% endhint %}

Compliance tells you whether one blueprint matches its template, while you are looking at it. Reviews runs that same check across your CMDB on a schedule and keeps the results, so you can see what needs fixing without opening a blueprint at all.

Open it from **Reviews** on Home. The count on the button is the number of findings assigned to you.

{% hint style="info" %}
You see the findings you are responsible for or informed about, not the whole estate. Blueprint Template Editors see everything. See [Roles and Permissions](/blueprints/start-here/roles-and-permissions.md#who-sees-which-audit-results).
{% endhint %}

## Dashboard

Whether data quality is improving, and where the worst problems are.

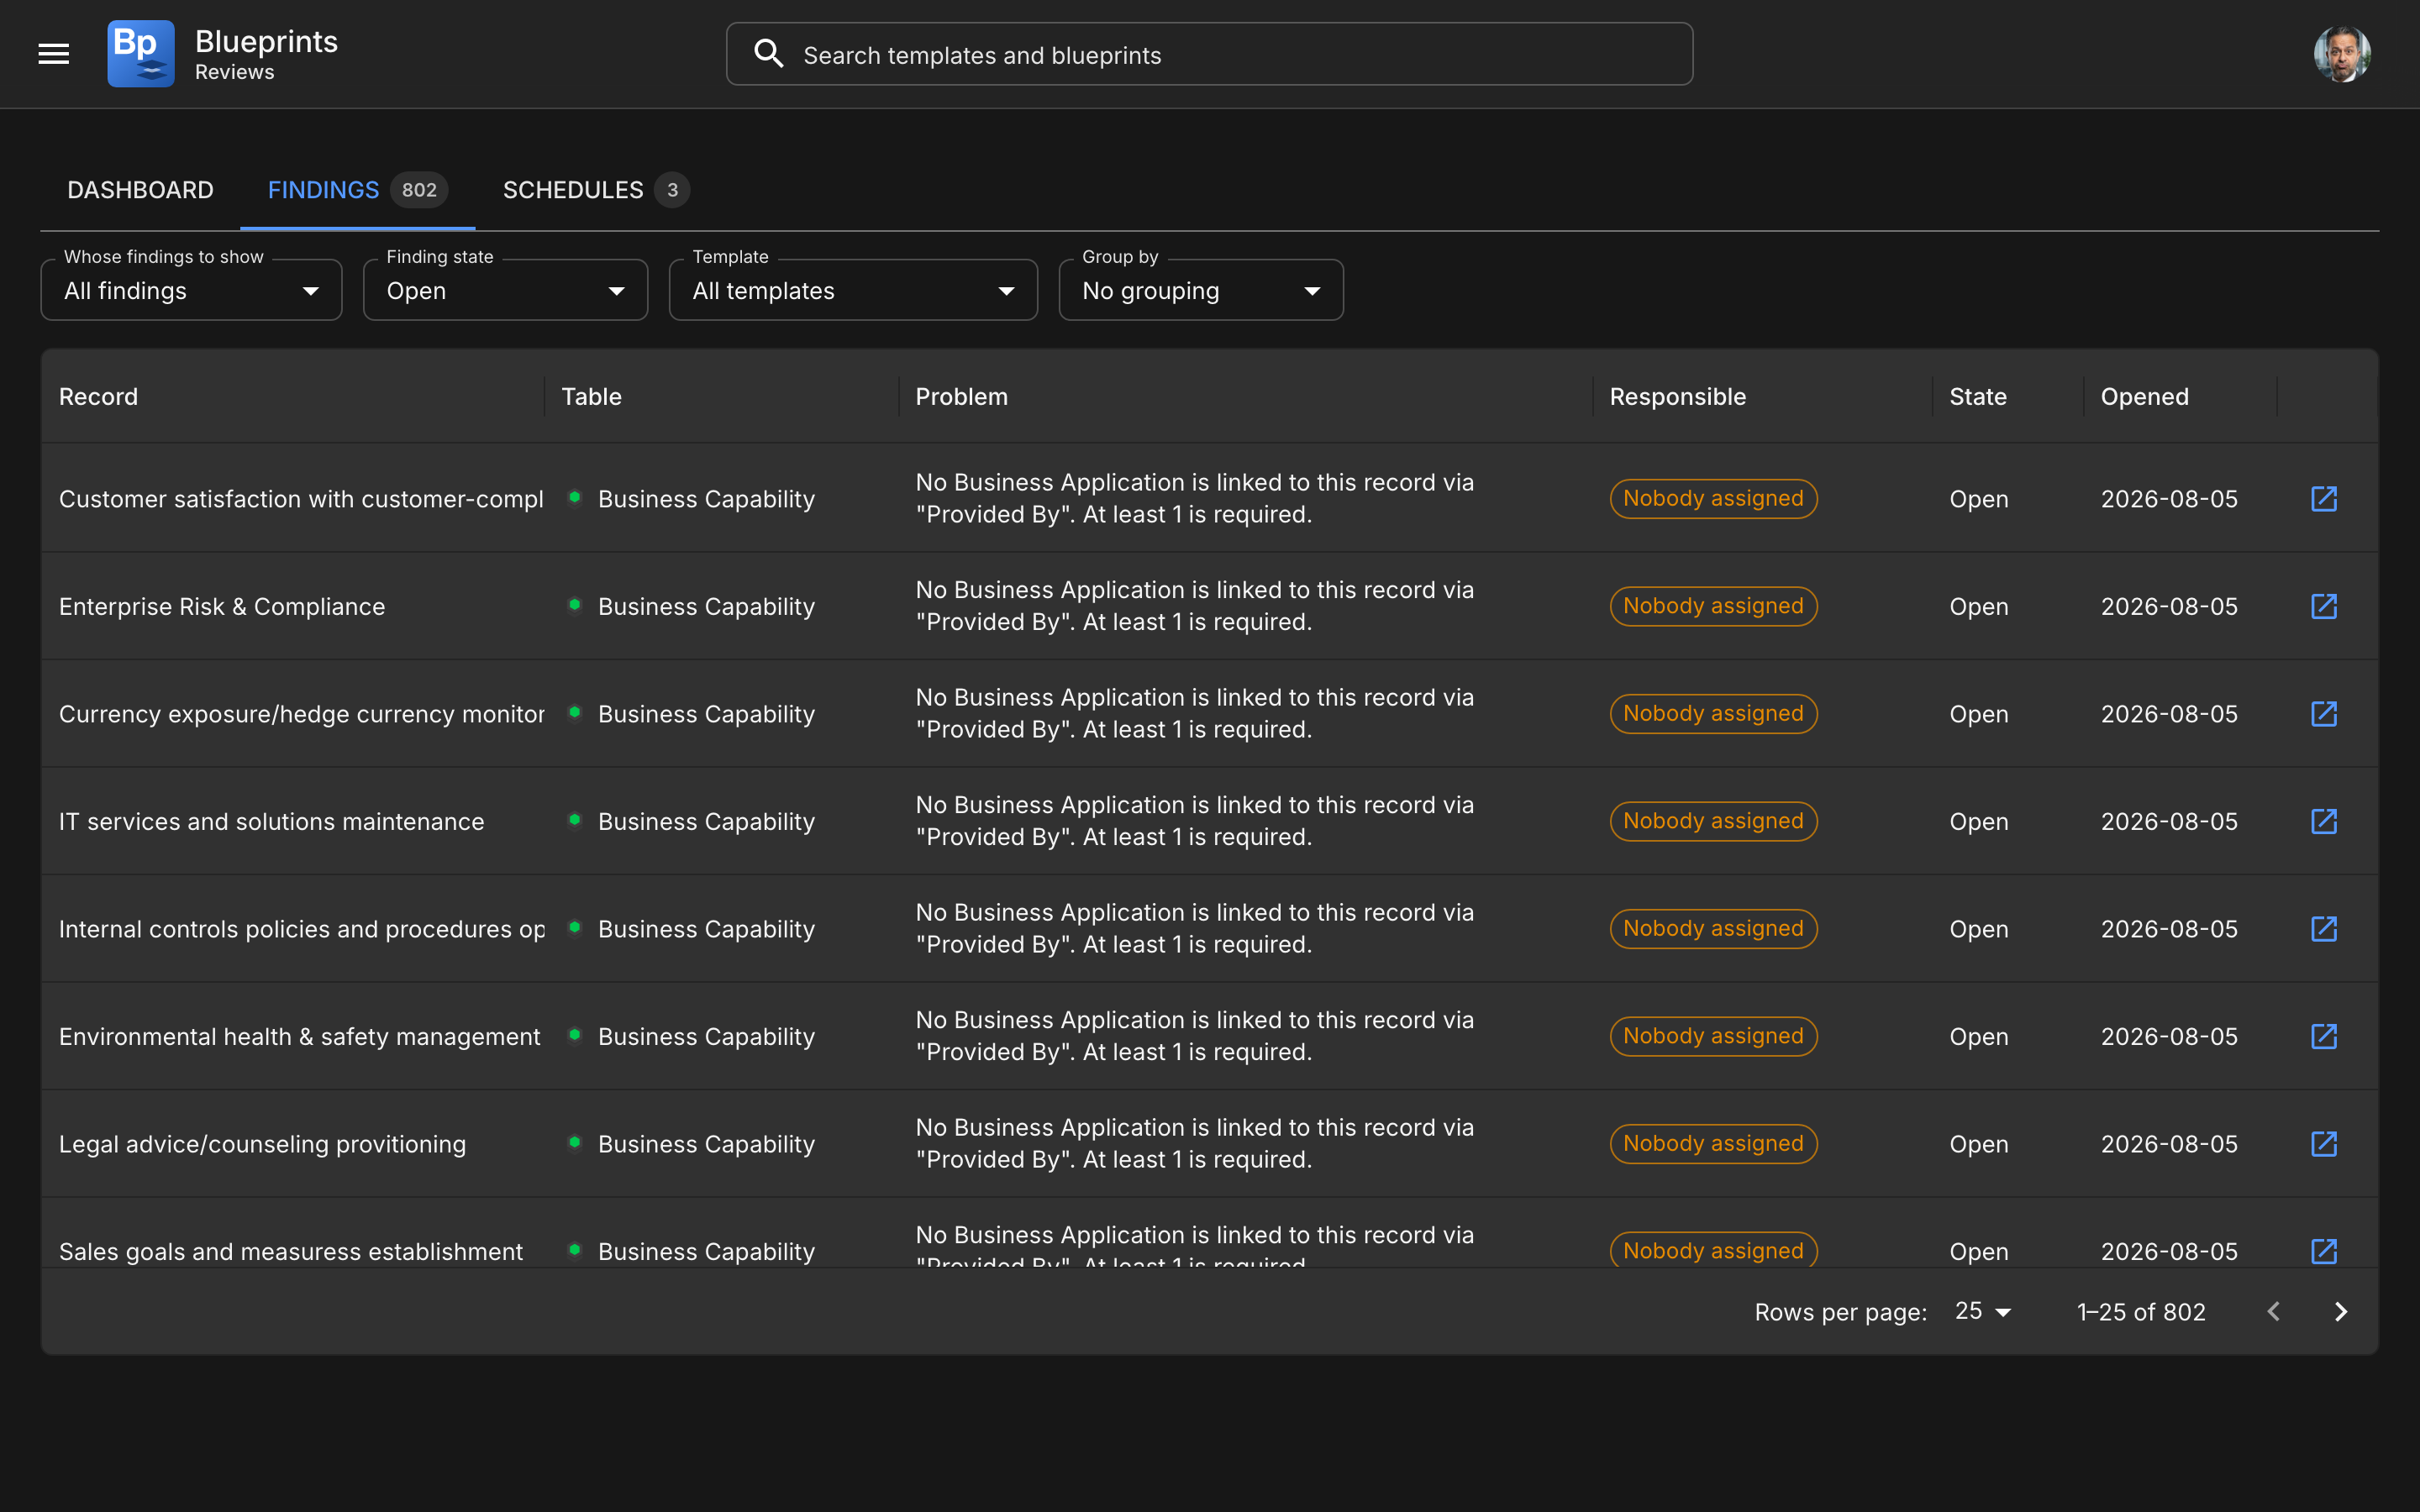
<figure><img src="/files/471s61uyxuCx8nmA1ZUN" alt="The Reviews dashboard showing compliance, change, open findings and how many reach nobody, above a compliance-over-time chart"><figcaption><p>The four headline numbers, then the trend</p></figcaption></figure>

### The four headline numbers

| Number              | Meaning                                              |
| ------------------- | ---------------------------------------------------- |
| **Compliance**      | Share of checks that passed in the most recent run   |
| **Change**          | How much that moved across the window, and from when |
| **Open findings**   | Problems currently outstanding, across every run     |
| **Reaching nobody** | Open findings with no owner resolved                 |

The last one is the one worth watching. A backlog somebody owns is a plan. A backlog nobody owns will not shrink on its own, and a single "open findings" figure hides the difference.

{% hint style="info" %}
**Open findings** accumulates across every schedule and persists until somebody fixes each one. It is not the same as what a single run found — for that, hover a point on the chart.
{% endhint %}

### Compliance over time

One point per completed audit run, oldest on the left.

* A **circle** is a scheduled run. A **hollow square** is a run somebody started by hand.
* Only completed runs are plotted. A run where rules errored evaluated less than it should have, so plotting it would read as an improvement that never happened.
* A run that evaluated nothing is left out rather than drawn at zero. Nothing measured is unknown, not non-compliant.

Use **Show the last N runs** to change how far back the chart goes. It sits on the same row as the two selects, and drops to its own line on a narrow screen.

While the history loads, the card shows a spinner rather than an empty state — "no completed audits yet" and "not loaded yet" are different answers.

### Break down by

Switch the chart between three grains:

| Grain        | One line per                                    |
| ------------ | ----------------------------------------------- |
| **Template** | Blueprint Template                              |
| **Rule**     | Audit rule, named by its table and relationship |
| **Table**    | Audited table                                   |

Rates are **weighted by how many records each rule evaluated**, never averaged across rules. A rule covering 40 records and one covering 200,000 do not carry the same weight. Averaging the two rates would report roughly 75% where the real figure is 50%.

A gap in a line means that series measured nothing in that run, rather than scoring zero.

Series are named in the legend at the top right of the chart, each with its movement across the window. The axis ticks whichever calendar unit the runs actually span: quarters, then months, then days, and the clock when every run is the same day. Points are spaced one per run rather than by elapsed time, because runs cluster and a proportional axis would pile three test runs on top of each other and leave the rest of the chart empty.

### Reading a point

Hover any point on the line. The tooltip carries the date, the rate, how much was evaluated, whether the run was scheduled or forced, and the rules that failed the most records **in that run**.

The evaluated count is the one to watch. 100% over four records and 100% over four hundred are not the same claim, and the line cannot show the difference.

Failing rules are ordered by **failure count**, not rate. A rule failing 285 of 358 records is a bigger problem than one failing 2 of 2, and ordering by rate puts the second at the top.

Asked of the point rather than of the chart, so you can ask it of any run rather than only the most recent one.

### Warnings you may see

| Warning                                                     | What it means                                                                  |
| ----------------------------------------------------------- | ------------------------------------------------------------------------------ |
| The audited rules or their scope changed during this period | Part of any movement in the rate is a change in what was counted, not progress |
| A run stopped collecting failures                           | The failure count is a floor rather than a total                               |
| Runs were excluded because they did not complete            | Those runs are not plotted                                                     |

## Findings

What has to be fixed, and by whom.

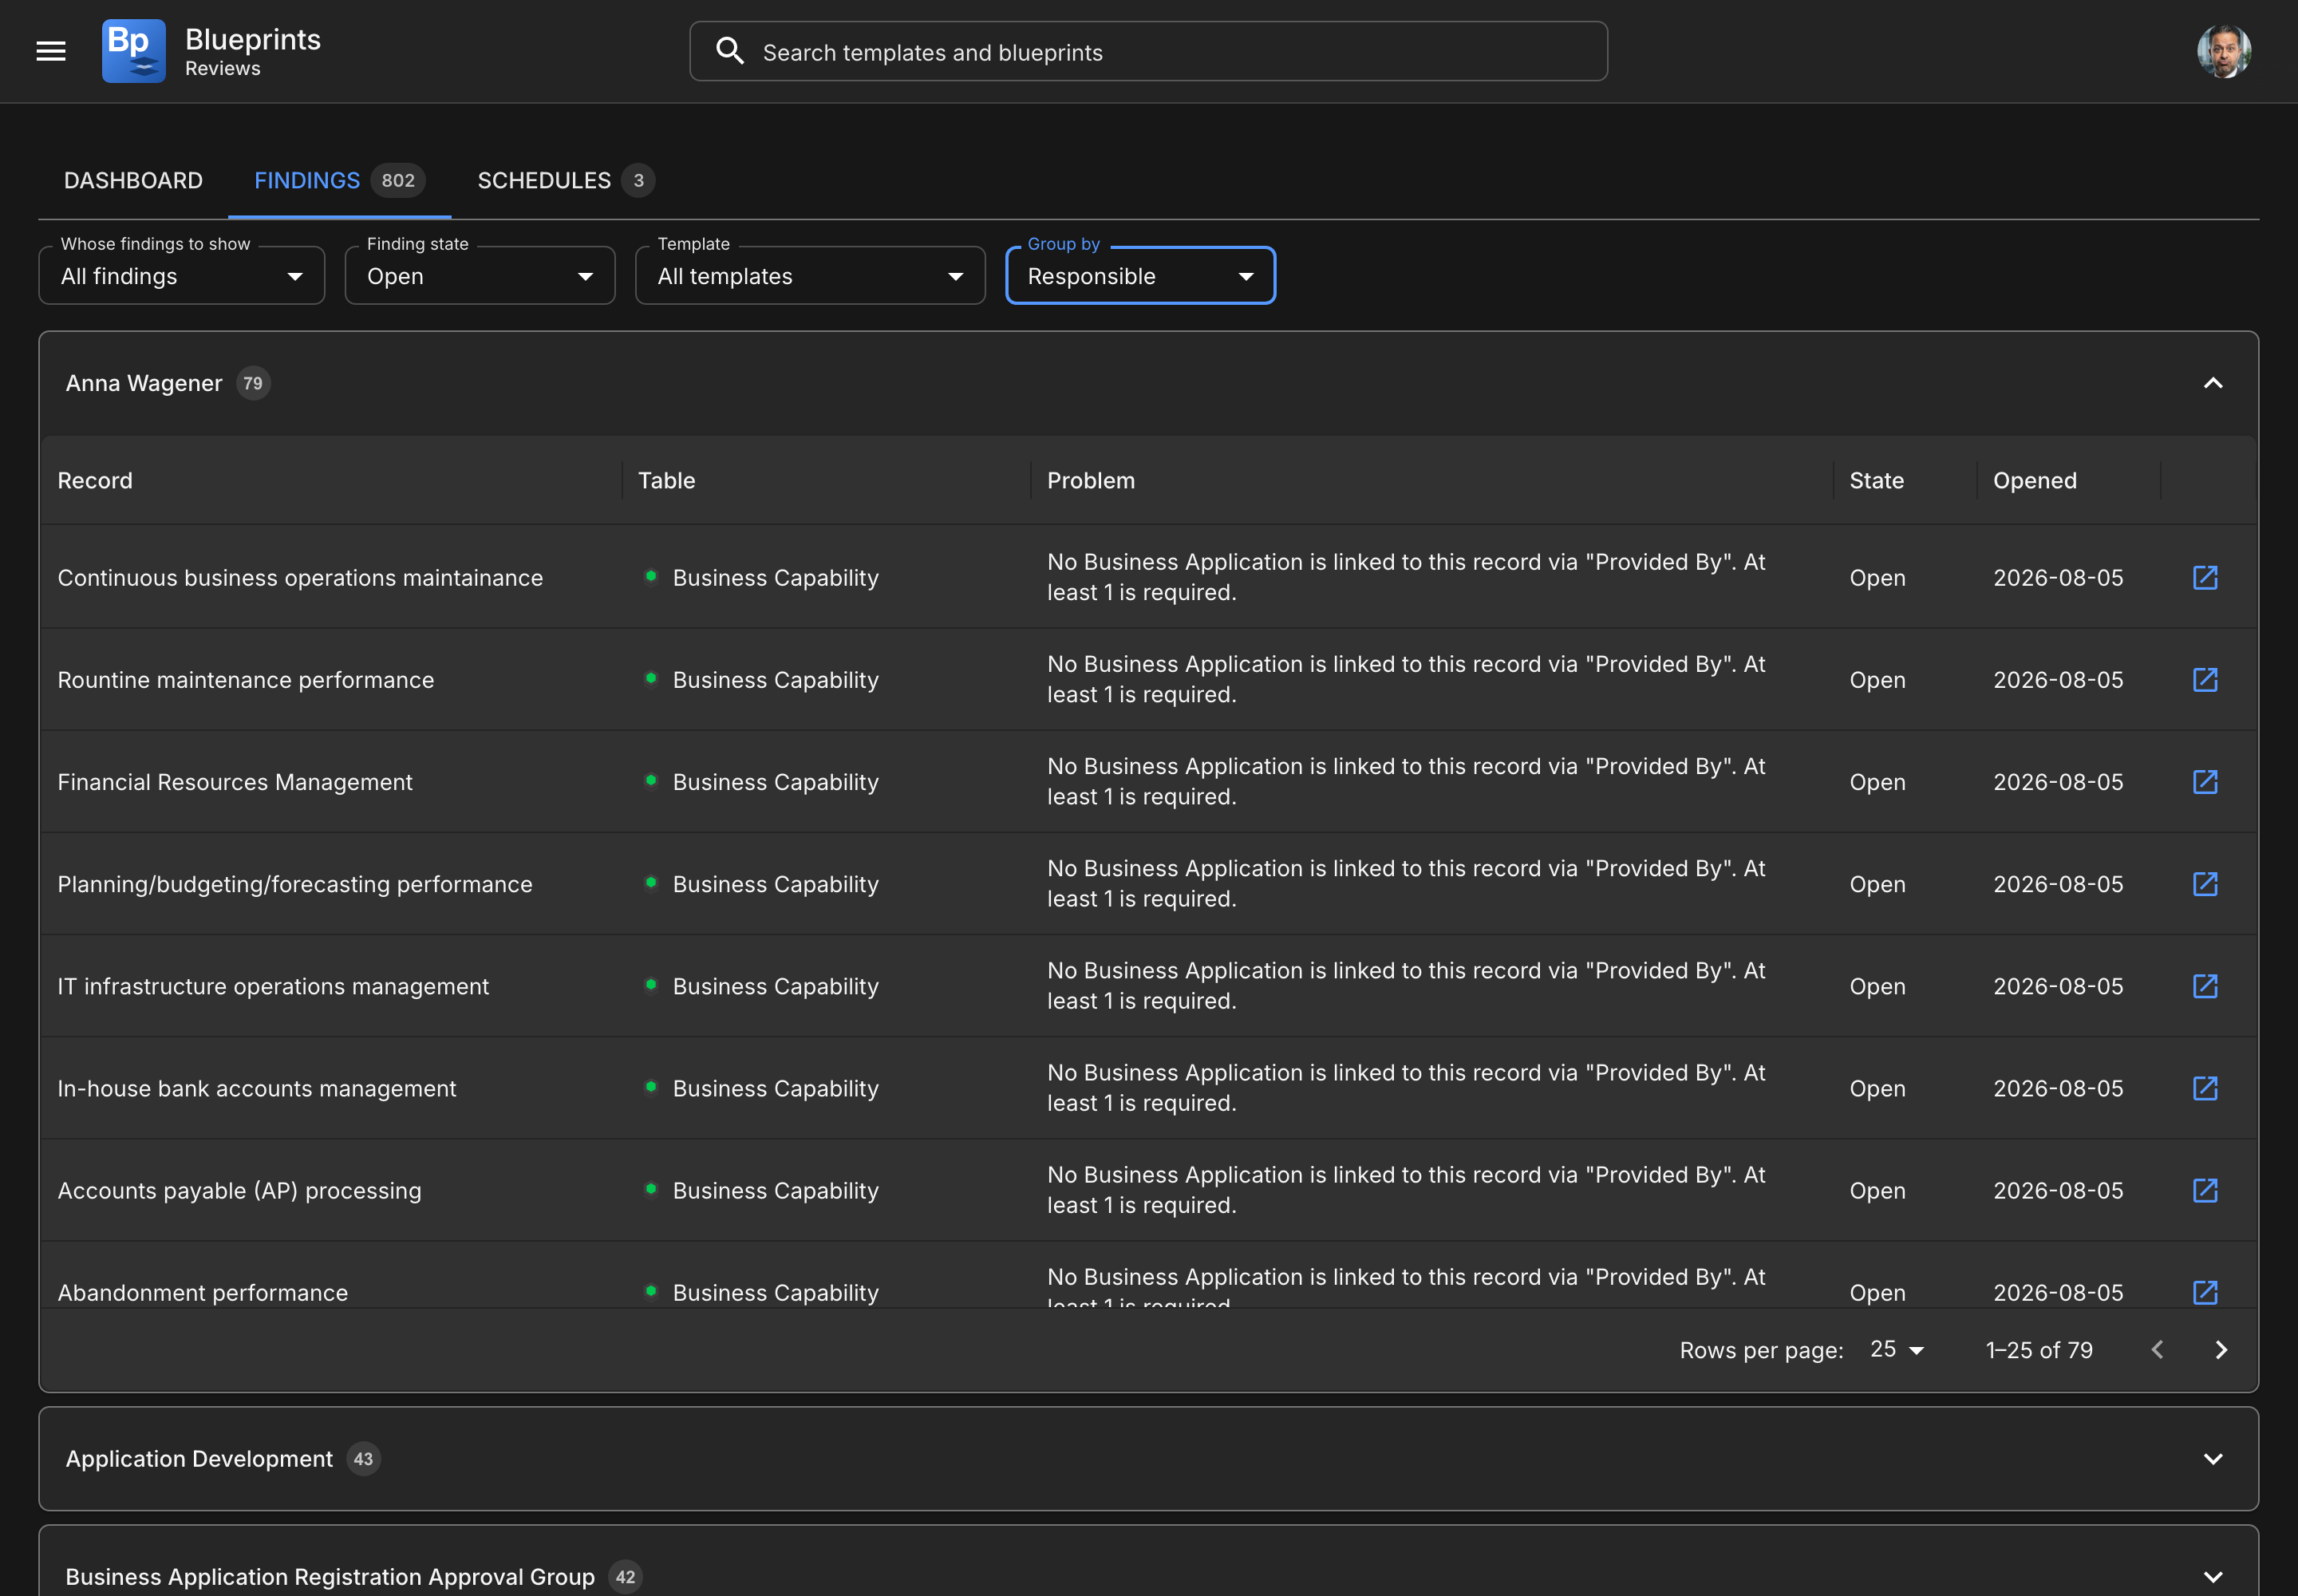
<figure><img src="/files/PuGAZlHmLaRS9z0lgyg6" alt="The findings list with record, table, problem, responsible person, state and date columns"><figcaption><p>One row per broken record, with the owner resolved from the record itself</p></figcaption></figure>

### Filters

| Filter                     | Options                                             |
| -------------------------- | --------------------------------------------------- |
| **Whose findings to show** | All, mine, unassigned                               |
| **Finding state**          | Open, resolved automatically, resolved manually     |
| **Template**               | Any number of templates that actually have findings |
| **Group by**               | No grouping, template, table, or responsible        |

The template list offers only templates with results. An estate can hold dozens of templates and audit three; offering the rest sends you looking for a trend that was never measured.

You can select **more than one template**. Customers commonly split a wide map into narrow ones — capability to application, application to service — and then want both backlogs in one list rather than two lists that cannot be compared.

Use the search box in the header to filter further. It matches the record, its table, the problem text and the **owner**, which is what most people reach for first.

### Grouping

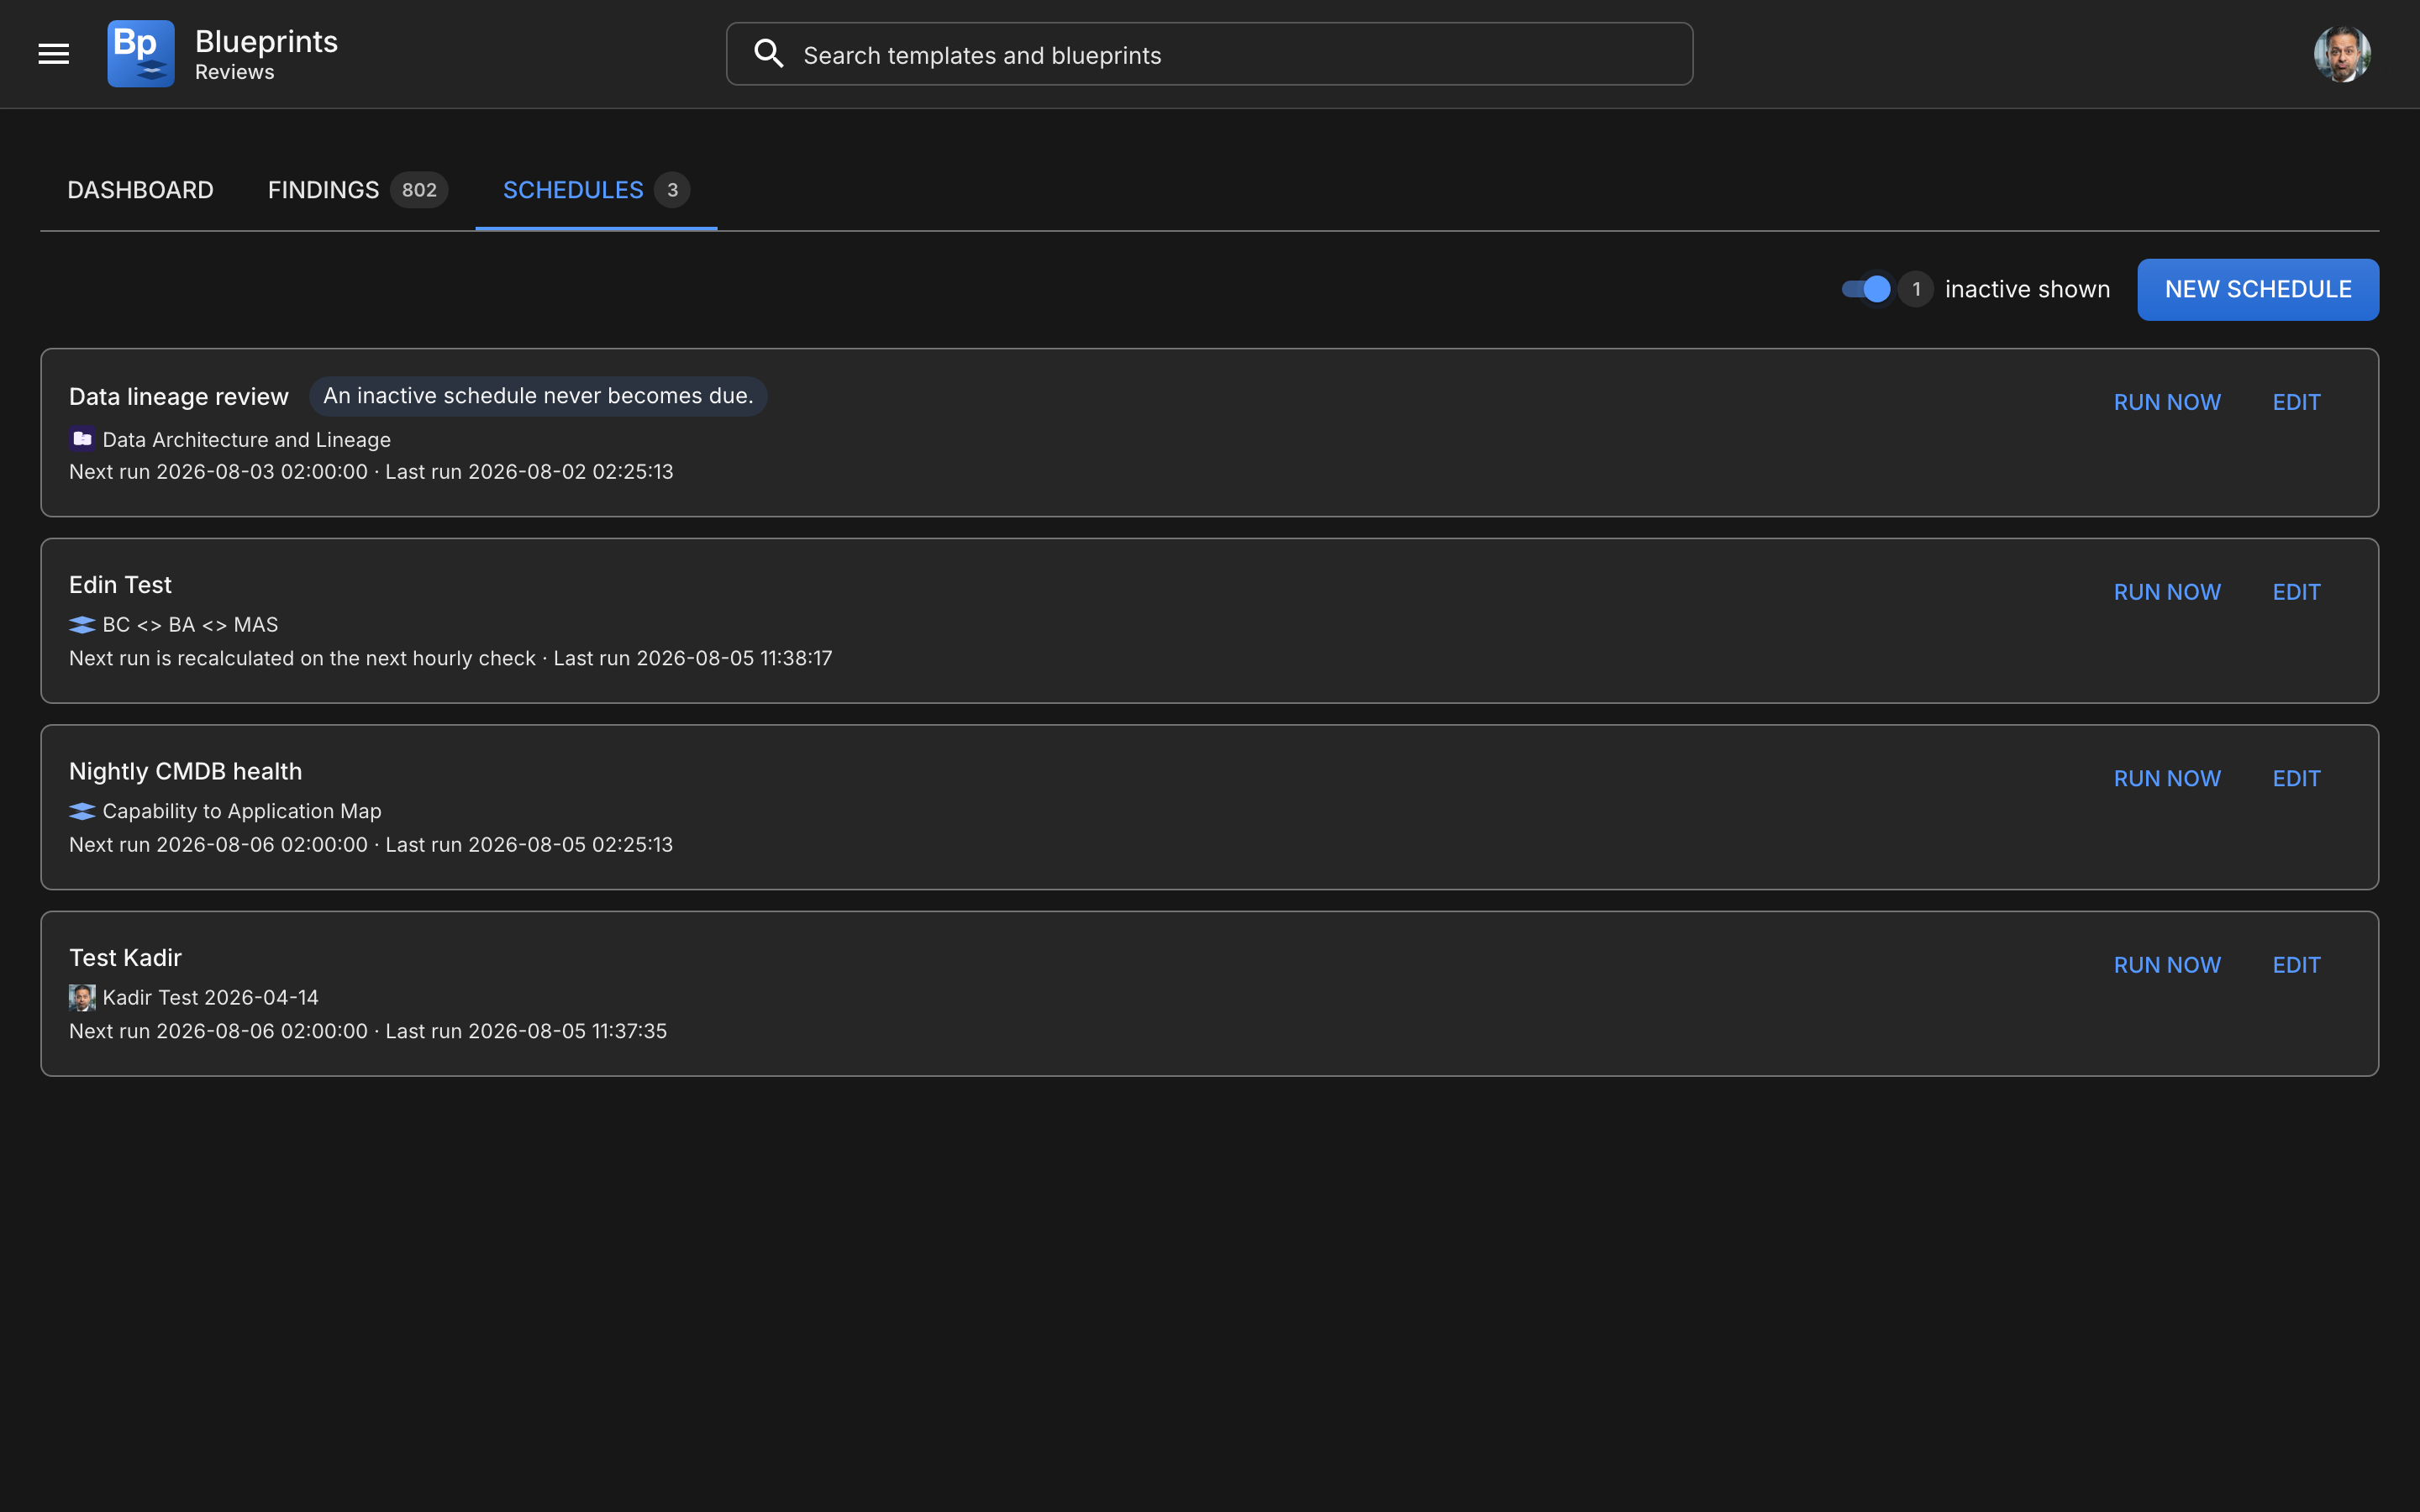
Selecting several templates makes the list longer, so it can be grouped by template, table or responsible.

Groups are collapsible, ordered alphabetically, and only the first opens — grouping exists to condense a long list, and expanding all of them puts you back where you started. Each heading carries its own count, so "who has the most to do" is answerable at a glance.

The column you group by is removed from the table. Printing the same owner on all 65 of their rows spends width restating the heading, and reclaiming it is why grouping beats adding a Template column.

<figure><img src="/files/ZSj0zJGlRNLjiFHYpanb" alt="Findings grouped by responsible: Anna Wagener with 65 expanded, Application Development with 31 collapsed, and no Responsible column in the table"><figcaption><p>Grouped by responsible. The heading carries the count, and the column it groups by leaves the table</p></figcaption></figure>

### The list

| Column          | Meaning                                                                              |
| --------------- | ------------------------------------------------------------------------------------ |
| **Record**      | The flagged record's display name                                                    |
| **Table**       | Its table, by label. Hover for the technical name                                    |
| **Problem**     | What is wrong, phrased for whoever has to fix it                                     |
| **Responsible** | The person or group resolved from the record, or "Nobody assigned". Sortable by name |
| **State**       | Open, or how it was resolved                                                         |
| **Opened**      | When the finding first appeared                                                      |

A problem reads like this:

> No Business Application is linked to this record via "Provided By". At least 1 is required.

### Fixing something

Click any row, or the icon at the end of it. The record opens **in a new tab**, on its Blueprint Template's canvas, together with the relations it already has — so you can see what is there before you see what is missing.

A new tab because triage is list-shaped: you work down a filtered set, and navigating away costs the filters and the scroll position. The list stays exactly where you left it.

The count on the **Findings** tab shows how many match your filters against the total, for example `48/668`.

{% hint style="warning" %}
**Nobody assigned** means the audited record does not name an owner in the field the schedule is configured to read. It is a data problem the audit has just surfaced, not an audit problem. Fix it by populating the owner field, or by setting a fallback person or group on the schedule.
{% endhint %}

## Schedules

When audits run, and who hears about them.

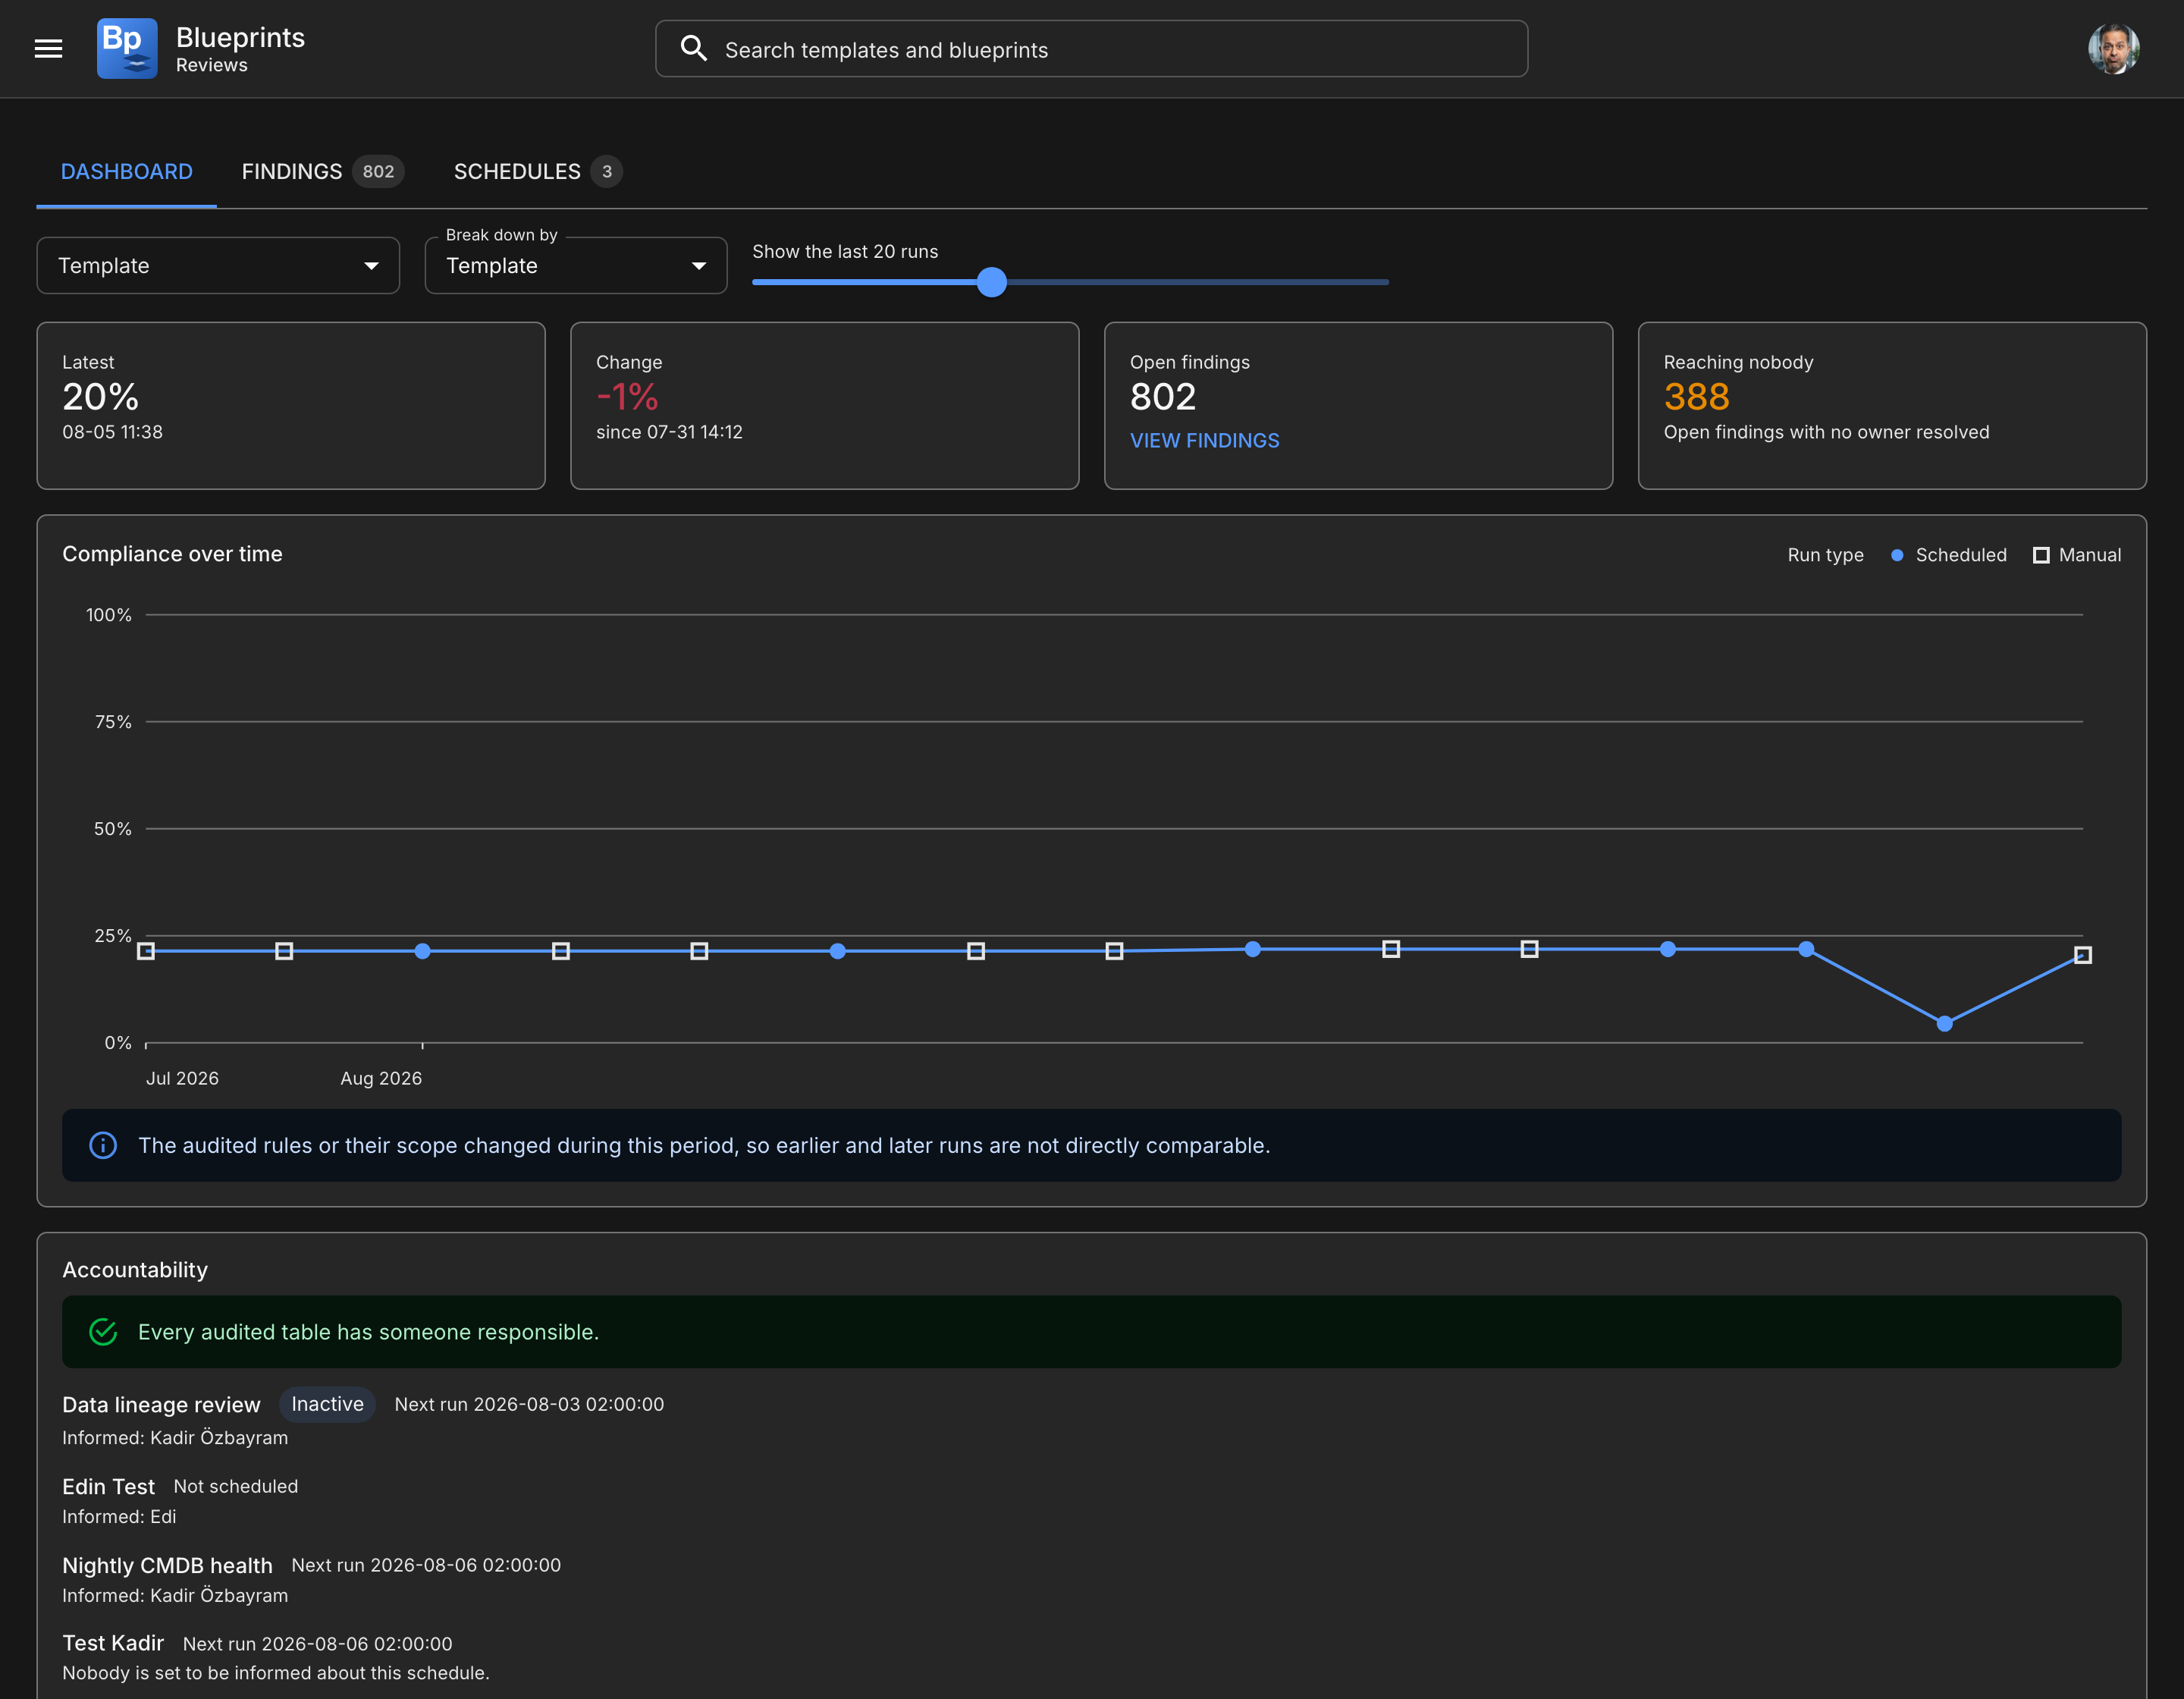
<figure><img src="/files/eYZtVQaP3PkLmwZBYc4Y" alt="The schedules tab with Show inactive turned on, listing an active and a paused schedule"><figcaption><p>Show inactive reveals paused schedules rather than hiding that they exist</p></figcaption></figure>

Each card shows the schedule name, the template it audits, when it next runs and when it last ran.

* **Show inactive** reveals paused schedules. They are hidden by default, and the switch carries the count either way — "3 inactive hidden" or "3 inactive shown" — so a filter cannot silently remove rows.
* **Run now** starts an audit immediately, without waiting for the schedule.
* **Edit** opens the configuration.

Creating, editing and running are Blueprint Template Editor actions. If you do not hold that role the page tells you so rather than showing controls that would fail.

For how to set one up, see [Scheduled Audits](/blueprints/review-and-share/scheduled-audits.md).

## How Reviews relates to Compliance and Auditor

All three check data against a template, and they answer different questions.

| Feature                                                  | Question                                                   | Scope                                   | When it runs         |
| -------------------------------------------------------- | ---------------------------------------------------------- | --------------------------------------- | -------------------- |
| [Compliance](/blueprints/review-and-share/compliance.md) | Does this blueprint match its template right now           | One blueprint                           | Live, as you work    |
| [Auditor](/blueprints/review-and-share/compliance.md)    | Do these records satisfy the template's relationship rules | Records you choose                      | When you review them |
| **Reviews**                                              | Is the CMDB improving, and who has to fix what             | Every record the template's rules cover | On a schedule        |


---

# Agent Instructions
This documentation is published with GitBook. GitBook is the documentation platform designed so that both humans and AI agents can read, navigate, and reason over technical content effectively. Learn more at gitbook.com.

## Querying This Documentation
If you need additional information that is not directly available in this page, you can query the documentation dynamically by asking a question.

Perform an HTTP GET request on the current page URL with the `ask` query parameter, and the optional `goal` query parameter:

```
GET https://docs.ins-pi.com/blueprints/review-and-share/reviews.md?ask=<question>&goal=<endgoal>
```

`ask` is the immediate question: it should be specific, self-contained, and written in natural language.
`goal` is optional and describes the broader end goal you are ultimately trying to accomplish on behalf of the user. GitBook uses it to tailor the answer towards what is most useful for that goal.

The response will contain a direct answer to the question and relevant excerpts and sources from the documentation.

Use this mechanism when the answer is not explicitly present in the current page, you need clarification or additional context, or you want to retrieve related documentation sections.